

Delta Lake optimization: cutting costs and improving performance
Delta Lake optimization: cutting costs and improving performance

When cloud costs start increasing in Databricks, most teams immediately look at cluster sizes, job schedules, or workload volumes. The assumption is usually that more data means more cost. While that can be true, it is often not the full story.
Delta Lake optimization is usually treated as a maintenance task rather than a business concern. Teams know that some jobs are running slower than before, dashboards take longer to refresh, and monthly cloud bills keep increasing. Very few people, however, connect these issues back to table design decisions that were made months earlier.
Over time, small files start accumulating, tables become poorly partitioned, and queries scan much more data than they actually need. Individually, these issues may not seem serious. But as they continue to grow, they can significantly impact platform performance, cloud spend, and the overall user experience.
The business sees the impact differently. Leadership sees increasing cloud costs. Business users experience slow dashboards and delayed reports. Data teams spend more time troubleshooting performance issues instead of working on new initiatives. What started as a technical problem slowly becomes an operational and financial one.
In this article, we walk through some of the most common Delta Lake optimization issues we encounter, explain the business impact behind them, and discuss practical techniques including OPTIMIZE, ZORDER, partitioning strategies, and workload design improvements that can improve performance while reducing unnecessary Databricks costs.
Why Delta Lake optimization is a business conversation
How table design decisions compound into cost and performance problems
When a new data pipeline is built, the primary focus is usually getting data loaded and making reports available to the business. At that stage, data volumes are relatively small, so performance issues are rarely visible. As a result, table design decisions such as partitioning strategy, file size management, and data layout often do not receive much attention.
The challenge starts as data grows. What worked well for a few million records may not work efficiently for hundreds of millions. Small files begin to accumulate, partitions become less effective, and queries end up scanning significantly more data than necessary. Jobs continue to run successfully, but they require more compute resources and take longer to complete.
Because these issues develop gradually, they often go unnoticed until cloud costs increase, reporting SLAs are missed, or users begin experiencing slower dashboards. At that point, the business sees rising costs and performance problems, while the root cause often traces back to table design decisions made months or even years earlier.
This is why Delta Lake optimization should be considered early in the design process rather than treated as a cleanup activity later. Good table design helps organizations maintain performance, control cloud spend, and scale efficiently as data volumes grow.
The gap between how engineers and leadership experience the same problem
Engineers and business leaders often look at optimization from completely different perspectives.
Engineers typically see it as a technical activity. They focus on file sizes, partitioning strategies, query execution plans, cluster utilization, and table maintenance. When a query takes longer than expected, they investigate the underlying technical reasons and look for ways to improve performance.
Leadership rarely sees those technical details. Instead, they experience the outcomes: increasing cloud bills, delayed reports, missed SLAs, and business users complaining about slow dashboards. From their perspective, the question is not whether a table needs optimization. The question is why costs are increasing and why the platform is becoming slower despite continued investment.
This gap creates a real challenge. A data engineering team may know exactly why performance is declining, but if the issue is communicated only in technical terms, the business may not fully understand the impact. When optimization is linked to measurable outcomes such as reduced cloud spend, faster reporting, improved user experience, and better scalability, it becomes much easier to justify the effort.
Delta Lake optimization should be viewed as more than a technical best practice. It is an operational and business decision that directly affects cost efficiency, reporting performance, and the ability of the platform to support future growth.
Why cloud spend, reporting SLAs, and platform scalability are all connected
At first glance, cloud costs, reporting performance, and platform scalability may seem like separate challenges. In reality, they are often connected through the way Delta tables are designed and maintained.
When Delta tables are not optimized, queries end up scanning more data than necessary. To compensate for slower performance, teams often increase cluster sizes or add more compute resources. While this may improve performance temporarily, it also increases cloud spending without resolving the underlying issue.
The impact is also visible in reporting SLAs. As tables grow larger and query performance declines, reports and dashboards take longer to refresh. Jobs that once completed comfortably within their scheduled windows begin running closer to SLA deadlines. Eventually, even minor increases in data volume can cause reporting delays that affect business users.
Scalability becomes the next challenge. A platform that struggles to support current workloads will find it even harder to support new dashboards, additional data sources, or advanced analytics initiatives. Instead of enabling growth, the platform becomes a bottleneck.
This is why Delta Lake optimization is much more than a performance exercise. Well-optimized tables reduce unnecessary data scans, lower compute consumption, improve reporting reliability, and create a platform that can scale efficiently as business demands grow.
The most common Delta Lake problems and what they actually cost
Small file accumulation: how it happens and what it costs
One of the most common Delta Lake issues is small file accumulation. It usually does not happen because of a bad design decision. Instead, it develops gradually as pipelines continue running over time.
Many ingestion processes write data into Delta tables in small batches throughout the day. Streaming workloads, frequent micro-batches, and repeated incremental loads can create thousands of small files. Initially, everything appears to work normally. Data loads successfully, reports refresh on time, and there are no obvious performance concerns.
The problem becomes visible as data volumes grow. Instead of reading a few large files, Databricks has to manage and scan thousands of smaller files to answer the same query. Before any data is processed, the platform spends additional time reading file metadata, identifying file locations, and coordinating tasks across the cluster. As the number of files increases, so does the overhead.
From a business perspective, the impact shows up in two areas. First, query performance starts to decline. Reports and dashboards take longer to load because more files need to be scanned. Second, compute costs increase because clusters spend more time processing the same workload. Teams often respond by increasing cluster size, which raises cloud spend even further without addressing the root cause.
We have seen cases where tables containing millions of records performed poorly not because of the amount of data, but because that data was spread across thousands of small files. After running optimization and file compaction, query runtimes improved significantly and compute usage dropped without any changes to the business logic.
Small file management is one of the most important aspects of Delta Lake optimization. What begins as a minor operational issue can eventually become a major contributor to both performance degradation and rising cloud costs.
Poor partitioning strategies: when partition choices slow down the workloads they were meant to help
Partitioning is one of the most effective ways to improve performance in Delta Lake, but only when it is aligned with how the data is actually queried. Tables can be partitioned with the best intentions and still end up creating more problems than they solve.
A common mistake is partitioning on columns with very high cardinality, such as customer IDs, transaction IDs, or claim IDs. While it may seem logical to organize data this way, it can create thousands of small partitions and significantly increase metadata overhead. In other cases, tables are partitioned on columns that are rarely used in filters, which means Databricks cannot take advantage of partition pruning during query execution.
The result is that queries end up scanning far more data than necessary. Jobs take longer to complete, dashboards become slower, and compute consumption increases. From the business perspective, this appears as rising cloud costs and inconsistent reporting performance, even though the underlying issue is the partitioning strategy itself.
We have seen reporting workloads where users primarily filtered data by date, but the table was partitioned on a different column that was rarely used in queries. As data volumes grew, query performance gradually declined because Databricks had to scan multiple partitions to retrieve the required records. After redesigning the partition strategy around actual query patterns, performance improved noticeably without requiring additional compute resources.
Partitioning should never be treated as a one-time design decision. As workloads evolve, query patterns change, and data volumes increase, partition strategies should be reviewed periodically. The goal is not simply to partition data, but to partition it in a way that supports how the business actually consumes it.
Inefficient query patterns: how upstream design decisions create downstream bottlenecks
Not every performance issue in Databricks is caused by the cluster or the volume of data being processed. In many cases, the root cause can be traced back to decisions made much earlier in the data pipeline.
Tables designed without considering how they would eventually be queried often lead to reporting workloads that rely heavily on full-table scans, unnecessary joins, repeated aggregations, and queries that process significantly more data than required. Everything works initially, but as data volumes increase, performance starts to decline.
A common example is when dashboards and reports repeatedly query raw transactional tables instead of curated datasets designed for analytics. Each report execution forces Databricks to scan large amounts of data, consume additional compute resources, and perform the same transformations repeatedly. What appears to be a reporting issue is often an upstream design issue.
The impact grows as more users and workloads depend on the same tables. Queries take longer to complete, dashboards become slower, and job runtimes increase. To maintain performance, teams often add more compute resources, which increases cloud costs without addressing the actual bottleneck.
Many of these challenges can be avoided by designing data models and pipelines with downstream consumption in mind. Curated Delta tables, proper filtering strategies, optimized joins, and reusable transformation layers reduce the amount of data that needs to be processed for each workload. This not only improves performance but also reduces unnecessary compute consumption.
Inefficient query patterns are rarely isolated problems. They are often symptoms of upstream design decisions that no longer align with how the business consumes data.
Practical optimization techniques that deliver measurable results
OPTIMIZE: what it does, when to run it, and what it fixes
One of the simplest and most effective ways to improve Delta Lake performance is the OPTIMIZE command. Small file accumulation is usually one of the first things to check when investigating slow-running queries or rising compute costs.
As data is loaded into Delta tables through batch jobs, streaming workloads, or incremental pipelines, thousands of small files can gradually accumulate. While the data itself remains correct, Databricks has to spend additional time managing and scanning those files before it can process the actual query. This overhead increases compute consumption and slows down workloads.
The OPTIMIZE command addresses this by compacting multiple small files into fewer, larger files that are more efficient to read. Instead of scanning thousands of files, Databricks can process the same data using a much smaller number of optimized files.
OPTIMIZE claims_delta_table;
OPTIMIZE is most valuable on large tables that receive frequent inserts, updates, or incremental loads. The exact frequency depends on the workload, but tables that support reporting, dashboards, and analytics often benefit from a regular optimization schedule.
The business impact can be significant. Query runtimes improve because less file metadata needs to be processed. Dashboards load faster, reporting jobs complete sooner, and clusters spend less time executing the same workload. In many cases, organizations can achieve better performance without increasing compute resources, which helps control cloud costs while improving the overall user experience.
OPTIMIZE is not a one-time activity. As new data continues to arrive, small files can reappear over time. Treating optimization as a regular part of platform operations helps maintain consistent performance and prevents minor inefficiencies from turning into larger cost and scalability challenges.
ZORDER: how to use clustering to speed up selective queries
While OPTIMIZE helps reduce the number of files in a Delta table, ZORDER focuses on how the data is organized within those files. These two techniques are complementary: OPTIMIZE improves file efficiency, while ZORDER improves how quickly Databricks can locate the data users are actually looking for.
In many reporting and analytics workloads, users rarely query an entire table. Instead, they filter on specific columns such as customer_id, claim_id, policy_number, product_category, or transaction_date. Without clustering, Databricks may still need to scan a large number of files to find matching records, even if only a small portion of the data is required.
ZORDER reorganizes data so that related values are stored closer together. This allows Databricks to take advantage of data skipping, which means it can ignore files that do not contain the values being requested. As a result, less data is scanned and queries complete more quickly.
OPTIMIZE claims_delta_table
ZORDER delivers the most value on large tables that support frequent filtering and lookup operations. If business users regularly search for specific claims, customers, or policies, clustering the table on those commonly queried columns can significantly improve performance.
The business benefit is straightforward. Faster queries mean quicker dashboard refreshes, shorter report runtimes, and a better experience for end users. At the same time, because Databricks scans less data, compute consumption decreases. Organizations are able to improve performance without simply increasing cluster size or spending more on infrastructure.
One important point: ZORDER should be based on actual query patterns, not assumptions. Before selecting columns for clustering, it is worth reviewing query history and understanding how users interact with the data.
Partitioning done right: choosing partition columns that match actual query patterns
Partitioning is one of the first optimization techniques many teams implement in Delta Lake, but its effectiveness depends entirely on choosing the right columns. Tables can be partitioned from day one and still see performance decline if the partition strategy does not match how the data is actually queried.
The goal of partitioning is simple: help Databricks read only the data that is needed instead of scanning the entire table. This works best when the partition column aligns with the filters most commonly used by downstream workloads. If reports and dashboards frequently retrieve data for a specific day, month, or year, partitioning by a date column can significantly reduce the amount of data scanned.
A common mistake is selecting partition columns based on data structure rather than query behavior. Columns with very high cardinality, such as customer IDs or transaction IDs, can create thousands of small partitions and increase metadata overhead. In these situations, the partitioning strategy can actually hurt performance instead of improving it.
The most successful partitioning decisions start with understanding how the business consumes data. Before creating partitions, it is worth reviewing dashboard filters, reporting requirements, and query history. The question should not be "Which column can I partition by?" but rather "Which column do users consistently filter on?"
For example, if most reporting queries filter on claim_date, partitioning by claim_date allows Databricks to perform partition pruning and read only the relevant subset of data. Instead of scanning years of records, the platform can access only the required partitions, reducing query runtime and compute consumption.
Better partitioning leads to faster reports, more predictable dashboard performance, and lower cloud costs because less data is processed during each query. As data volumes continue to grow, a well-designed partition strategy also helps the platform scale without requiring proportional increases in compute resources.
Workload design improvements: addressing the patterns that create problems in the first place
Techniques such as OPTIMIZE, ZORDER, and partitioning can significantly improve performance, but the biggest gains often come from fixing the workload patterns that created the problem in the first place.
In many Databricks environments, performance issues are symptoms of inefficient workload design rather than problems with Delta Lake itself. Full-table scans are scheduled when only incremental data needs to be processed. Multiple reports repeatedly query the same raw datasets instead of using curated tables. Jobs reprocess historical data every day even though only a small percentage of records have changed.
Initially, these approaches may seem harmless because workloads are small and performance is acceptable. As data volumes grow, the inefficiencies become more expensive. Jobs take longer to complete, clusters consume more compute resources, and cloud costs continue to increase.
One improvement that consistently delivers results is moving from full-load processing to incremental processing wherever possible. Instead of scanning an entire table, the pipeline processes only new or changed records. Another effective approach is creating curated Delta tables that serve reporting workloads directly, reducing the need for repeated transformations and complex joins.
It is also important to review scheduled jobs periodically. Many organizations continue running workloads that were designed years ago, even though business requirements have changed. Identifying unnecessary processing and eliminating redundant workloads can have an immediate impact on both performance and cost.
The business value extends beyond faster queries. Better workload design reduces compute consumption, improves reporting reliability, and creates a platform that can scale without requiring constant infrastructure upgrades. More importantly, data engineering teams spend less time troubleshooting performance issues and more time delivering new capabilities that support business growth.
Governance, security, and enterprise readiness
How optimization interacts with Unity Catalog table management
As Databricks environments grow, optimization becomes about more than just performance. It also needs to fit within the governance and security framework that enterprise teams rely on. This is where Unity Catalog plays an important role.
A common question is whether optimization activities such as OPTIMIZE and ZORDER affect governance controls. They do not. These operations improve the physical layout of data without changing the table's ownership, permissions, lineage, or governance policies managed through Unity Catalog.
Data teams can therefore optimize Delta tables while maintaining the same access controls that business users, analysts, and downstream applications depend on. Users continue to access the data through the same governed tables, while the underlying storage becomes more efficient.
Unity Catalog also provides a centralized view of data assets, ownership, and lineage across the platform. This makes it easier for teams to identify critical tables, understand how they are being used, and prioritize optimization efforts where they will have the greatest impact. Instead of optimizing every table indiscriminately, organizations can focus on the datasets that support the most important reporting, analytics, and business operations.
Optimization is most effective when it is treated as part of an overall data management strategy rather than an isolated performance activity. When Delta Lake optimization and Unity Catalog governance work together, organizations gain both operational efficiency and stronger control over their data assets.
Keeping lineage and access controls intact through optimization operations
One concern teams sometimes raise is whether optimization activities could impact governance, security, or data visibility. This is especially important in environments where multiple teams rely on the same datasets and strict access controls are required.
Optimization operations such as OPTIMIZE and ZORDER focus on improving how data is physically stored and accessed. They do not change the business meaning of the data, modify user permissions, or break lineage relationships that have already been established through Unity Catalog.
For example, if a finance team has read access to a reporting table and an engineering team performs an optimization on that table, the finance team's access remains unchanged. Data lineage continues to track how data moves between source systems, pipelines, and downstream reports. From a user's perspective, the table behaves exactly the same way. It simply performs more efficiently.
This is particularly valuable in enterprise environments where governance requirements are just as important as performance. Organizations need to improve query speed and reduce cloud costs without introducing risk to compliance, auditing, or security processes.
The best approach is to treat optimization as part of regular platform maintenance while continuing to manage permissions, ownership, and lineage through Unity Catalog. This allows engineering teams to improve performance behind the scenes while business users continue working with the same trusted and governed datasets.
What enterprise teams should audit before running large-scale optimization jobs
Before running optimization activities across hundreds or thousands of Delta tables, it is important to understand where the biggest opportunities exist. A targeted approach usually delivers better results with less effort than trying to optimize everything at once.
The first area to review is query history and workload patterns. Understanding which tables support critical reports, dashboards, and business processes helps identify where optimization will have the greatest impact. Tables that are rarely accessed may not provide the same return on investment as heavily used reporting datasets.
File counts are another useful indicator. Tables containing large numbers of small files are often strong candidates for OPTIMIZE because they tend to generate unnecessary metadata overhead and increased compute consumption. Reviewing table statistics can quickly highlight these problem areas.
It is also worth examining partitioning strategies. As business requirements evolve, partition structures that once worked well may no longer align with current query patterns. Auditing frequently used filters and reporting requirements can reveal opportunities to improve partition pruning and reduce data scans.
From a governance perspective, enterprise teams should confirm table ownership, data classifications, and access requirements before making large-scale changes. While optimization does not affect permissions, understanding who depends on a dataset helps avoid scheduling optimization jobs during critical reporting periods.
Finally, it is worth reviewing the business impact of each table. Not all optimization opportunities are equal. A table supporting executive dashboards or daily operational reporting may deliver far greater value than one that is accessed only occasionally.
The most successful optimization programs focus on measurable outcomes rather than simply reducing file counts. By auditing workload importance, query patterns, table health, and business usage first, organizations can prioritize efforts that improve performance, reduce cloud costs, and deliver the greatest value to end users.
The business value of getting this right
Lower cloud compute costs through reduced scan and shuffle overhead
For many organizations, the most visible benefit of Delta Lake optimization is lower cloud spend. Inefficient data scans and unnecessary data movement are often major contributors to rising compute bills.
When Delta tables are not optimized, Databricks may need to scan significantly more data than a query actually requires. Small files, poor partitioning strategies, and inefficient query patterns all increase the amount of work the platform must perform. As a result, clusters run longer, consume more resources, and generate higher compute costs.
Shuffle operations can also have a significant impact. Whenever large amounts of data need to be redistributed across worker nodes for joins, aggregations, or transformations, additional compute resources are consumed. Poorly optimized tables often increase the amount of data being moved unnecessarily.
We have seen situations where teams responded to performance issues by increasing cluster sizes rather than addressing the root cause. While larger clusters may temporarily improve query performance, they also increase cloud spending. In many cases, optimizing the underlying Delta tables delivered similar or better performance improvements without requiring additional infrastructure.
When queries scan less data and workloads perform fewer unnecessary shuffle operations, jobs complete faster and consume fewer compute resources. As data volumes continue to grow, these savings become even more important. A well-optimized Delta Lake environment not only improves current workload efficiency but also helps prevent cloud costs from growing at the same rate as the data itself.
Faster reporting and dashboard performance for end users
While cloud cost savings often get the most attention, the benefit that business users notice first is usually faster reporting and dashboard performance.
Dashboards that once loaded in a few seconds can gradually become slower as data volumes increase. Reports that previously completed within acceptable timeframes start taking significantly longer, creating frustration for users who relied on timely information to make decisions. In many cases, the issue is not the reporting tool itself. It is the underlying Delta tables supporting those workloads.
When tables are optimized, Databricks can retrieve data more efficiently. Proper partitioning, file compaction, and ZORDER reduce the amount of data that needs to be scanned and processed for each query. As a result, reports and dashboards respond faster, even as data volumes continue to grow.
The business impact goes beyond user convenience. Faster dashboards enable teams to access information when they need it rather than waiting for reports to load. Operational teams can respond more quickly to business events, managers can make decisions using current data, and analysts spend less time waiting for queries to complete.
Performance improvements also help organizations meet reporting SLAs more consistently. Data pipelines complete on time, scheduled reports are delivered when expected, and business users gain greater confidence in the platform. When reporting systems perform reliably, support requests related to slow dashboards and delayed reports tend to decrease as well.
Users rarely notice when a table has been optimized. What they notice is that the information they need becomes available faster.
A more scalable platform that supports new use cases without proportional cost growth
One of the biggest challenges organizations face is scaling their data platforms as business demands continue to grow. New dashboards are created, additional data sources are onboarded, reporting requirements expand, and teams begin exploring advanced analytics and AI initiatives. The question is whether the platform can support that growth efficiently.
We have seen environments where every increase in workload required a corresponding increase in compute resources. As more data arrived and more users accessed the platform, cloud costs grew at almost the same rate. While the platform technically scaled, it became increasingly expensive to operate.
Poorly optimized Delta tables often contribute to this problem. When workloads repeatedly scan unnecessary data, process inefficient partitions, or perform excessive shuffle operations, each new use case adds more pressure to the platform. Over time, teams are forced to increase cluster sizes simply to maintain existing performance levels.
Optimization helps break that pattern. When data is organized efficiently and queries process only the information they actually need, the platform can support larger workloads without requiring proportional increases in infrastructure. New reports, dashboards, and analytics workloads can be introduced while keeping compute growth under control.
This becomes particularly important as organizations expand their use of data. Business teams want faster access to insights, leadership wants more reporting capabilities, and data teams are often expected to support machine learning and AI initiatives on the same platform. A well-optimized Delta Lake foundation makes that growth sustainable.
From a business perspective, scalability is not just about handling more data. It is about supporting new opportunities without allowing costs to grow at the same pace.
How to assess your current Delta Lake health
Signals that your tables need attention: slow queries, rising costs, growing file counts
Problems with Delta Lake optimization usually develop gradually rather than appearing overnight. Because of that, many teams do not realize their tables need attention until performance issues start affecting business users or cloud costs begin increasing noticeably.
The first signal to look for is slow query performance. If dashboards that once loaded in seconds are now taking noticeably longer, or if reporting jobs are consistently running close to SLA deadlines, it is worth investigating the underlying Delta tables. While some slowdown is expected as data grows, significant performance degradation can indicate optimization issues.
Another common indicator is rising compute costs without a corresponding increase in business value. Cloud spending can continue to climb even though the number of reports, users, and workloads remains relatively stable. In many cases, inefficient table layouts, unnecessary data scans, or small file accumulation are contributing to the increased resource consumption.
Growing file counts are another warning sign. As ingestion pipelines continue writing data, thousands of small files can accumulate over time. The data itself may be correct, but Databricks must spend additional effort managing and scanning those files before executing queries. This often results in slower performance and higher compute usage.
It is also worth paying attention to operational patterns. Frequent cluster scaling, longer job runtimes, increased shuffle activity, and repeated performance tuning efforts can all indicate that the underlying table structure is no longer supporting the workload efficiently.
The key is to identify these signals early. Addressing optimization challenges when they first appear is typically much easier and less expensive than waiting until reporting performance, cloud costs, and user satisfaction are significantly affected.
A starting framework for prioritizing which tables to optimize first
When organizations begin looking at Delta Lake optimization, one of the first questions is where to start. In large Databricks environments, there may be hundreds or even thousands of tables, making it unrealistic to optimize everything at once.
The most effective approach is to focus on business impact first. Start by identifying the tables that support critical dashboards, executive reporting, operational processes, or high-visibility analytics workloads. Improvements in these areas are often noticed immediately by both business users and leadership.
Next, look at query activity and compute consumption. Tables that are queried frequently and consume a significant amount of cluster resources typically offer the greatest optimization opportunities. Even small performance improvements on heavily used datasets can generate meaningful cost savings over time.
File count is another useful indicator. Tables containing large numbers of small files are often strong candidates for optimization because they can create unnecessary metadata overhead and increase scan times. Similarly, tables experiencing rapid growth in data volume should be reviewed before performance issues become more difficult to manage.
It is also worth reviewing workload patterns. If multiple reports, dashboards, or pipelines depend on the same table, optimizing that dataset can improve performance across several downstream processes at once. These shared datasets often provide the highest return on effort.
In practice, a simple three-tier prioritization works well:
High priority: Business-critical tables with high query volume, growing costs, or visible performance issues.
Medium priority: Frequently used datasets that show early signs of inefficiency but are not yet impacting users significantly.
Low priority: Infrequently accessed tables with minimal business impact or stable performance.
The goal is not to optimize the largest tables first. The goal is to optimize the tables that deliver the greatest business value.
How to build optimization into regular platform operations rather than treating it as a one-off fix
One mistake organizations make is treating Delta Lake optimization as a project rather than an ongoing operational practice. A team notices performance issues, runs a few optimization commands, sees immediate improvements, and then moves on. Unfortunately, the conditions that created the problem often continue, which means the same issues gradually return over time.
Data platforms are constantly evolving. New data arrives every day, workloads change, additional reports are created, and business users develop new ways of consuming data. As these changes occur, file counts grow, query patterns shift, and previously effective optimization strategies may become less efficient.
The most successful teams build optimization into their regular platform operations. Instead of waiting for performance complaints or unexpected cloud cost increases, they proactively monitor table health, query performance, file counts, and workload efficiency. Optimization becomes part of routine maintenance, similar to monitoring pipelines or managing data quality.
Regular review cycles for high-priority datasets help teams periodically evaluate query history, review partition effectiveness, identify growing file counts, and determine whether tables would benefit from OPTIMIZE or ZORDER operations. This allows issues to be addressed before they begin affecting business users.
Automation can also play an important role. Scheduled optimization jobs, monitoring dashboards, and operational alerts help ensure that performance and efficiency remain consistent as data volumes grow. Rather than relying on manual intervention, optimization becomes a repeatable process within the platform.
The business benefit is long-term stability. Cloud costs remain more predictable, reporting performance stays consistent, and the platform continues to scale without requiring frequent reactive tuning efforts. Instead of constantly fixing performance problems, data teams can focus on delivering new capabilities and supporting business growth.
Is your Delta Lake working against you?
The business case for proactive optimization
Organizations invest heavily in modern data platforms to improve reporting, support analytics, and create a foundation for future growth. Many performance and cost challenges, however, are not caused by the platform itself. They are often the result of optimization decisions that were delayed, overlooked, or never revisited as workloads evolved.
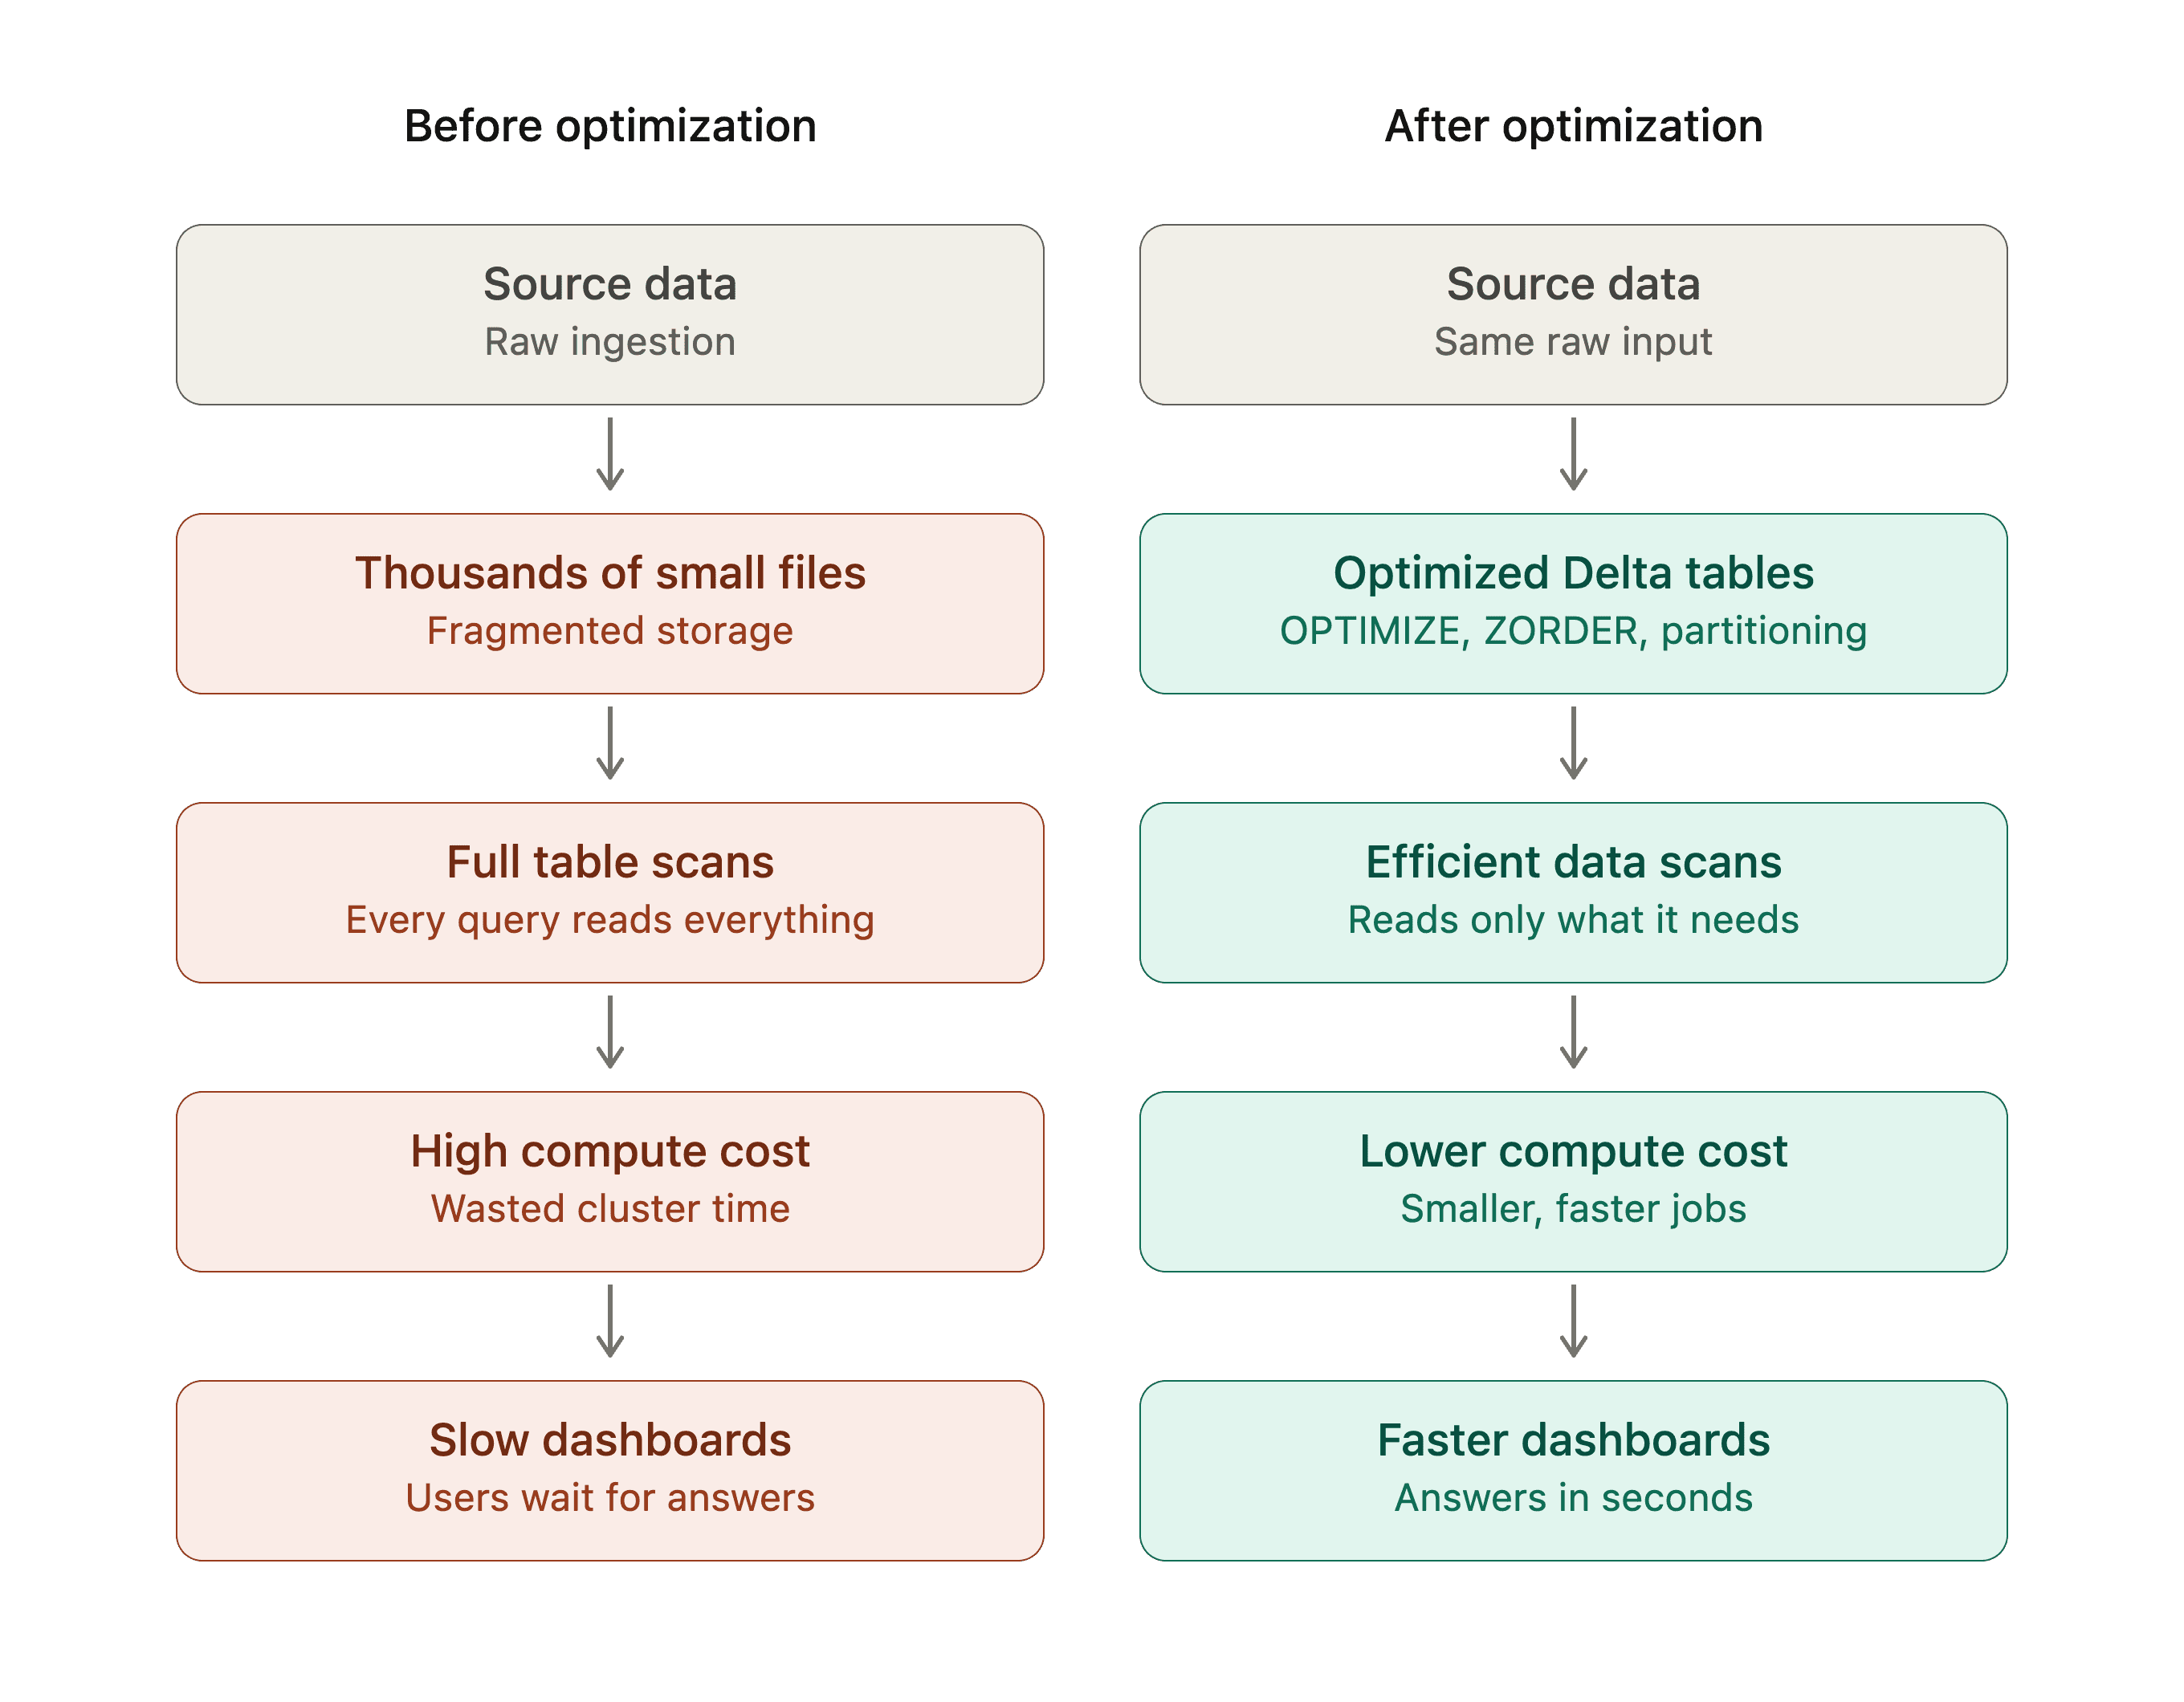
What starts as a few small inefficiencies can gradually become a larger business problem. Small file accumulation increases compute consumption. Poor partitioning causes unnecessary data scans. Inefficient query patterns slow down reports and dashboards. Over time, cloud costs rise, reporting performance declines, and scaling the platform becomes more expensive than it needs to be.
These challenges are often solvable. Techniques such as OPTIMIZE, ZORDER, proper partitioning, and thoughtful workload design can significantly improve performance while reducing unnecessary compute usage. More importantly, they help organizations get greater value from their existing Databricks investments rather than simply adding more infrastructure.
Delta Lake optimization is not just about making queries run faster. It is about controlling cloud costs, meeting reporting SLAs, improving user experience, and building a platform that can support future business needs without proportional cost growth.
If your cloud spend is increasing, dashboards are becoming slower, or platform performance is becoming harder to maintain, it may be worth asking a simple question: is the problem really your workload volume, or is your Delta Lake no longer optimized for the way your business uses data today?
Answering that question early can help prevent small technical inefficiencies from becoming larger operational and financial challenges down the road.
Questions engineering and data leaders should be asking today
As data volumes continue to grow, optimization becomes less about technical housekeeping and more about operational efficiency. Engineering and data leaders should regularly consider the following:
Are our most critical Delta tables optimized for the way users actually query them?
Is cloud spend increasing because of business growth, or because of inefficient workloads?
Which tables consume the most compute resources, and are they delivering proportional business value?
Are we proactively monitoring table health, or only reacting when performance issues appear?
Can our current platform support new analytics, reporting, and AI initiatives without significantly increasing costs?
Next steps and how Tenjumps can help
Delta Lake optimization is not a one-time exercise. As workloads evolve and data volumes grow, maintaining an efficient platform requires a combination of good engineering practices, governance, and ongoing operational oversight.
At Tenjumps, we help organizations assess Delta Lake performance, identify inefficiencies, and implement practical optimization strategies that improve query performance, reduce cloud costs, and support long-term scalability. Whether the challenge is small file accumulation, ineffective partitioning, inefficient workloads, or overall platform optimization, the goal is the same: helping teams get more value from their Databricks investment.
The most successful optimization initiatives start with visibility. Understanding where performance bottlenecks and unnecessary costs exist today is often the first step toward building a faster, more scalable, and more cost-efficient data platform for tomorrow.

When cloud costs start increasing in Databricks, most teams immediately look at cluster sizes, job schedules, or workload volumes. The assumption is usually that more data means more cost. While that can be true, it is often not the full story.
Delta Lake optimization is usually treated as a maintenance task rather than a business concern. Teams know that some jobs are running slower than before, dashboards take longer to refresh, and monthly cloud bills keep increasing. Very few people, however, connect these issues back to table design decisions that were made months earlier.
Over time, small files start accumulating, tables become poorly partitioned, and queries scan much more data than they actually need. Individually, these issues may not seem serious. But as they continue to grow, they can significantly impact platform performance, cloud spend, and the overall user experience.
The business sees the impact differently. Leadership sees increasing cloud costs. Business users experience slow dashboards and delayed reports. Data teams spend more time troubleshooting performance issues instead of working on new initiatives. What started as a technical problem slowly becomes an operational and financial one.
In this article, we walk through some of the most common Delta Lake optimization issues we encounter, explain the business impact behind them, and discuss practical techniques including OPTIMIZE, ZORDER, partitioning strategies, and workload design improvements that can improve performance while reducing unnecessary Databricks costs.
Why Delta Lake optimization is a business conversation
How table design decisions compound into cost and performance problems
When a new data pipeline is built, the primary focus is usually getting data loaded and making reports available to the business. At that stage, data volumes are relatively small, so performance issues are rarely visible. As a result, table design decisions such as partitioning strategy, file size management, and data layout often do not receive much attention.
The challenge starts as data grows. What worked well for a few million records may not work efficiently for hundreds of millions. Small files begin to accumulate, partitions become less effective, and queries end up scanning significantly more data than necessary. Jobs continue to run successfully, but they require more compute resources and take longer to complete.
Because these issues develop gradually, they often go unnoticed until cloud costs increase, reporting SLAs are missed, or users begin experiencing slower dashboards. At that point, the business sees rising costs and performance problems, while the root cause often traces back to table design decisions made months or even years earlier.
This is why Delta Lake optimization should be considered early in the design process rather than treated as a cleanup activity later. Good table design helps organizations maintain performance, control cloud spend, and scale efficiently as data volumes grow.
The gap between how engineers and leadership experience the same problem
Engineers and business leaders often look at optimization from completely different perspectives.
Engineers typically see it as a technical activity. They focus on file sizes, partitioning strategies, query execution plans, cluster utilization, and table maintenance. When a query takes longer than expected, they investigate the underlying technical reasons and look for ways to improve performance.
Leadership rarely sees those technical details. Instead, they experience the outcomes: increasing cloud bills, delayed reports, missed SLAs, and business users complaining about slow dashboards. From their perspective, the question is not whether a table needs optimization. The question is why costs are increasing and why the platform is becoming slower despite continued investment.
This gap creates a real challenge. A data engineering team may know exactly why performance is declining, but if the issue is communicated only in technical terms, the business may not fully understand the impact. When optimization is linked to measurable outcomes such as reduced cloud spend, faster reporting, improved user experience, and better scalability, it becomes much easier to justify the effort.
Delta Lake optimization should be viewed as more than a technical best practice. It is an operational and business decision that directly affects cost efficiency, reporting performance, and the ability of the platform to support future growth.
Why cloud spend, reporting SLAs, and platform scalability are all connected
At first glance, cloud costs, reporting performance, and platform scalability may seem like separate challenges. In reality, they are often connected through the way Delta tables are designed and maintained.
When Delta tables are not optimized, queries end up scanning more data than necessary. To compensate for slower performance, teams often increase cluster sizes or add more compute resources. While this may improve performance temporarily, it also increases cloud spending without resolving the underlying issue.
The impact is also visible in reporting SLAs. As tables grow larger and query performance declines, reports and dashboards take longer to refresh. Jobs that once completed comfortably within their scheduled windows begin running closer to SLA deadlines. Eventually, even minor increases in data volume can cause reporting delays that affect business users.
Scalability becomes the next challenge. A platform that struggles to support current workloads will find it even harder to support new dashboards, additional data sources, or advanced analytics initiatives. Instead of enabling growth, the platform becomes a bottleneck.
This is why Delta Lake optimization is much more than a performance exercise. Well-optimized tables reduce unnecessary data scans, lower compute consumption, improve reporting reliability, and create a platform that can scale efficiently as business demands grow.
The most common Delta Lake problems and what they actually cost
Small file accumulation: how it happens and what it costs
One of the most common Delta Lake issues is small file accumulation. It usually does not happen because of a bad design decision. Instead, it develops gradually as pipelines continue running over time.
Many ingestion processes write data into Delta tables in small batches throughout the day. Streaming workloads, frequent micro-batches, and repeated incremental loads can create thousands of small files. Initially, everything appears to work normally. Data loads successfully, reports refresh on time, and there are no obvious performance concerns.
The problem becomes visible as data volumes grow. Instead of reading a few large files, Databricks has to manage and scan thousands of smaller files to answer the same query. Before any data is processed, the platform spends additional time reading file metadata, identifying file locations, and coordinating tasks across the cluster. As the number of files increases, so does the overhead.
From a business perspective, the impact shows up in two areas. First, query performance starts to decline. Reports and dashboards take longer to load because more files need to be scanned. Second, compute costs increase because clusters spend more time processing the same workload. Teams often respond by increasing cluster size, which raises cloud spend even further without addressing the root cause.
We have seen cases where tables containing millions of records performed poorly not because of the amount of data, but because that data was spread across thousands of small files. After running optimization and file compaction, query runtimes improved significantly and compute usage dropped without any changes to the business logic.
Small file management is one of the most important aspects of Delta Lake optimization. What begins as a minor operational issue can eventually become a major contributor to both performance degradation and rising cloud costs.
Poor partitioning strategies: when partition choices slow down the workloads they were meant to help
Partitioning is one of the most effective ways to improve performance in Delta Lake, but only when it is aligned with how the data is actually queried. Tables can be partitioned with the best intentions and still end up creating more problems than they solve.
A common mistake is partitioning on columns with very high cardinality, such as customer IDs, transaction IDs, or claim IDs. While it may seem logical to organize data this way, it can create thousands of small partitions and significantly increase metadata overhead. In other cases, tables are partitioned on columns that are rarely used in filters, which means Databricks cannot take advantage of partition pruning during query execution.
The result is that queries end up scanning far more data than necessary. Jobs take longer to complete, dashboards become slower, and compute consumption increases. From the business perspective, this appears as rising cloud costs and inconsistent reporting performance, even though the underlying issue is the partitioning strategy itself.
We have seen reporting workloads where users primarily filtered data by date, but the table was partitioned on a different column that was rarely used in queries. As data volumes grew, query performance gradually declined because Databricks had to scan multiple partitions to retrieve the required records. After redesigning the partition strategy around actual query patterns, performance improved noticeably without requiring additional compute resources.
Partitioning should never be treated as a one-time design decision. As workloads evolve, query patterns change, and data volumes increase, partition strategies should be reviewed periodically. The goal is not simply to partition data, but to partition it in a way that supports how the business actually consumes it.
Inefficient query patterns: how upstream design decisions create downstream bottlenecks
Not every performance issue in Databricks is caused by the cluster or the volume of data being processed. In many cases, the root cause can be traced back to decisions made much earlier in the data pipeline.
Tables designed without considering how they would eventually be queried often lead to reporting workloads that rely heavily on full-table scans, unnecessary joins, repeated aggregations, and queries that process significantly more data than required. Everything works initially, but as data volumes increase, performance starts to decline.
A common example is when dashboards and reports repeatedly query raw transactional tables instead of curated datasets designed for analytics. Each report execution forces Databricks to scan large amounts of data, consume additional compute resources, and perform the same transformations repeatedly. What appears to be a reporting issue is often an upstream design issue.
The impact grows as more users and workloads depend on the same tables. Queries take longer to complete, dashboards become slower, and job runtimes increase. To maintain performance, teams often add more compute resources, which increases cloud costs without addressing the actual bottleneck.
Many of these challenges can be avoided by designing data models and pipelines with downstream consumption in mind. Curated Delta tables, proper filtering strategies, optimized joins, and reusable transformation layers reduce the amount of data that needs to be processed for each workload. This not only improves performance but also reduces unnecessary compute consumption.
Inefficient query patterns are rarely isolated problems. They are often symptoms of upstream design decisions that no longer align with how the business consumes data.
Practical optimization techniques that deliver measurable results
OPTIMIZE: what it does, when to run it, and what it fixes
One of the simplest and most effective ways to improve Delta Lake performance is the OPTIMIZE command. Small file accumulation is usually one of the first things to check when investigating slow-running queries or rising compute costs.
As data is loaded into Delta tables through batch jobs, streaming workloads, or incremental pipelines, thousands of small files can gradually accumulate. While the data itself remains correct, Databricks has to spend additional time managing and scanning those files before it can process the actual query. This overhead increases compute consumption and slows down workloads.
The OPTIMIZE command addresses this by compacting multiple small files into fewer, larger files that are more efficient to read. Instead of scanning thousands of files, Databricks can process the same data using a much smaller number of optimized files.
OPTIMIZE claims_delta_table;
OPTIMIZE is most valuable on large tables that receive frequent inserts, updates, or incremental loads. The exact frequency depends on the workload, but tables that support reporting, dashboards, and analytics often benefit from a regular optimization schedule.
The business impact can be significant. Query runtimes improve because less file metadata needs to be processed. Dashboards load faster, reporting jobs complete sooner, and clusters spend less time executing the same workload. In many cases, organizations can achieve better performance without increasing compute resources, which helps control cloud costs while improving the overall user experience.
OPTIMIZE is not a one-time activity. As new data continues to arrive, small files can reappear over time. Treating optimization as a regular part of platform operations helps maintain consistent performance and prevents minor inefficiencies from turning into larger cost and scalability challenges.
ZORDER: how to use clustering to speed up selective queries
While OPTIMIZE helps reduce the number of files in a Delta table, ZORDER focuses on how the data is organized within those files. These two techniques are complementary: OPTIMIZE improves file efficiency, while ZORDER improves how quickly Databricks can locate the data users are actually looking for.
In many reporting and analytics workloads, users rarely query an entire table. Instead, they filter on specific columns such as customer_id, claim_id, policy_number, product_category, or transaction_date. Without clustering, Databricks may still need to scan a large number of files to find matching records, even if only a small portion of the data is required.
ZORDER reorganizes data so that related values are stored closer together. This allows Databricks to take advantage of data skipping, which means it can ignore files that do not contain the values being requested. As a result, less data is scanned and queries complete more quickly.
OPTIMIZE claims_delta_table
ZORDER delivers the most value on large tables that support frequent filtering and lookup operations. If business users regularly search for specific claims, customers, or policies, clustering the table on those commonly queried columns can significantly improve performance.
The business benefit is straightforward. Faster queries mean quicker dashboard refreshes, shorter report runtimes, and a better experience for end users. At the same time, because Databricks scans less data, compute consumption decreases. Organizations are able to improve performance without simply increasing cluster size or spending more on infrastructure.
One important point: ZORDER should be based on actual query patterns, not assumptions. Before selecting columns for clustering, it is worth reviewing query history and understanding how users interact with the data.
Partitioning done right: choosing partition columns that match actual query patterns
Partitioning is one of the first optimization techniques many teams implement in Delta Lake, but its effectiveness depends entirely on choosing the right columns. Tables can be partitioned from day one and still see performance decline if the partition strategy does not match how the data is actually queried.
The goal of partitioning is simple: help Databricks read only the data that is needed instead of scanning the entire table. This works best when the partition column aligns with the filters most commonly used by downstream workloads. If reports and dashboards frequently retrieve data for a specific day, month, or year, partitioning by a date column can significantly reduce the amount of data scanned.
A common mistake is selecting partition columns based on data structure rather than query behavior. Columns with very high cardinality, such as customer IDs or transaction IDs, can create thousands of small partitions and increase metadata overhead. In these situations, the partitioning strategy can actually hurt performance instead of improving it.
The most successful partitioning decisions start with understanding how the business consumes data. Before creating partitions, it is worth reviewing dashboard filters, reporting requirements, and query history. The question should not be "Which column can I partition by?" but rather "Which column do users consistently filter on?"
For example, if most reporting queries filter on claim_date, partitioning by claim_date allows Databricks to perform partition pruning and read only the relevant subset of data. Instead of scanning years of records, the platform can access only the required partitions, reducing query runtime and compute consumption.
Better partitioning leads to faster reports, more predictable dashboard performance, and lower cloud costs because less data is processed during each query. As data volumes continue to grow, a well-designed partition strategy also helps the platform scale without requiring proportional increases in compute resources.
Workload design improvements: addressing the patterns that create problems in the first place
Techniques such as OPTIMIZE, ZORDER, and partitioning can significantly improve performance, but the biggest gains often come from fixing the workload patterns that created the problem in the first place.
In many Databricks environments, performance issues are symptoms of inefficient workload design rather than problems with Delta Lake itself. Full-table scans are scheduled when only incremental data needs to be processed. Multiple reports repeatedly query the same raw datasets instead of using curated tables. Jobs reprocess historical data every day even though only a small percentage of records have changed.
Initially, these approaches may seem harmless because workloads are small and performance is acceptable. As data volumes grow, the inefficiencies become more expensive. Jobs take longer to complete, clusters consume more compute resources, and cloud costs continue to increase.
One improvement that consistently delivers results is moving from full-load processing to incremental processing wherever possible. Instead of scanning an entire table, the pipeline processes only new or changed records. Another effective approach is creating curated Delta tables that serve reporting workloads directly, reducing the need for repeated transformations and complex joins.
It is also important to review scheduled jobs periodically. Many organizations continue running workloads that were designed years ago, even though business requirements have changed. Identifying unnecessary processing and eliminating redundant workloads can have an immediate impact on both performance and cost.
The business value extends beyond faster queries. Better workload design reduces compute consumption, improves reporting reliability, and creates a platform that can scale without requiring constant infrastructure upgrades. More importantly, data engineering teams spend less time troubleshooting performance issues and more time delivering new capabilities that support business growth.
Governance, security, and enterprise readiness
How optimization interacts with Unity Catalog table management
As Databricks environments grow, optimization becomes about more than just performance. It also needs to fit within the governance and security framework that enterprise teams rely on. This is where Unity Catalog plays an important role.
A common question is whether optimization activities such as OPTIMIZE and ZORDER affect governance controls. They do not. These operations improve the physical layout of data without changing the table's ownership, permissions, lineage, or governance policies managed through Unity Catalog.
Data teams can therefore optimize Delta tables while maintaining the same access controls that business users, analysts, and downstream applications depend on. Users continue to access the data through the same governed tables, while the underlying storage becomes more efficient.
Unity Catalog also provides a centralized view of data assets, ownership, and lineage across the platform. This makes it easier for teams to identify critical tables, understand how they are being used, and prioritize optimization efforts where they will have the greatest impact. Instead of optimizing every table indiscriminately, organizations can focus on the datasets that support the most important reporting, analytics, and business operations.
Optimization is most effective when it is treated as part of an overall data management strategy rather than an isolated performance activity. When Delta Lake optimization and Unity Catalog governance work together, organizations gain both operational efficiency and stronger control over their data assets.
Keeping lineage and access controls intact through optimization operations
One concern teams sometimes raise is whether optimization activities could impact governance, security, or data visibility. This is especially important in environments where multiple teams rely on the same datasets and strict access controls are required.
Optimization operations such as OPTIMIZE and ZORDER focus on improving how data is physically stored and accessed. They do not change the business meaning of the data, modify user permissions, or break lineage relationships that have already been established through Unity Catalog.
For example, if a finance team has read access to a reporting table and an engineering team performs an optimization on that table, the finance team's access remains unchanged. Data lineage continues to track how data moves between source systems, pipelines, and downstream reports. From a user's perspective, the table behaves exactly the same way. It simply performs more efficiently.
This is particularly valuable in enterprise environments where governance requirements are just as important as performance. Organizations need to improve query speed and reduce cloud costs without introducing risk to compliance, auditing, or security processes.
The best approach is to treat optimization as part of regular platform maintenance while continuing to manage permissions, ownership, and lineage through Unity Catalog. This allows engineering teams to improve performance behind the scenes while business users continue working with the same trusted and governed datasets.
What enterprise teams should audit before running large-scale optimization jobs
Before running optimization activities across hundreds or thousands of Delta tables, it is important to understand where the biggest opportunities exist. A targeted approach usually delivers better results with less effort than trying to optimize everything at once.
The first area to review is query history and workload patterns. Understanding which tables support critical reports, dashboards, and business processes helps identify where optimization will have the greatest impact. Tables that are rarely accessed may not provide the same return on investment as heavily used reporting datasets.
File counts are another useful indicator. Tables containing large numbers of small files are often strong candidates for OPTIMIZE because they tend to generate unnecessary metadata overhead and increased compute consumption. Reviewing table statistics can quickly highlight these problem areas.
It is also worth examining partitioning strategies. As business requirements evolve, partition structures that once worked well may no longer align with current query patterns. Auditing frequently used filters and reporting requirements can reveal opportunities to improve partition pruning and reduce data scans.
From a governance perspective, enterprise teams should confirm table ownership, data classifications, and access requirements before making large-scale changes. While optimization does not affect permissions, understanding who depends on a dataset helps avoid scheduling optimization jobs during critical reporting periods.
Finally, it is worth reviewing the business impact of each table. Not all optimization opportunities are equal. A table supporting executive dashboards or daily operational reporting may deliver far greater value than one that is accessed only occasionally.
The most successful optimization programs focus on measurable outcomes rather than simply reducing file counts. By auditing workload importance, query patterns, table health, and business usage first, organizations can prioritize efforts that improve performance, reduce cloud costs, and deliver the greatest value to end users.
The business value of getting this right
Lower cloud compute costs through reduced scan and shuffle overhead
For many organizations, the most visible benefit of Delta Lake optimization is lower cloud spend. Inefficient data scans and unnecessary data movement are often major contributors to rising compute bills.
When Delta tables are not optimized, Databricks may need to scan significantly more data than a query actually requires. Small files, poor partitioning strategies, and inefficient query patterns all increase the amount of work the platform must perform. As a result, clusters run longer, consume more resources, and generate higher compute costs.
Shuffle operations can also have a significant impact. Whenever large amounts of data need to be redistributed across worker nodes for joins, aggregations, or transformations, additional compute resources are consumed. Poorly optimized tables often increase the amount of data being moved unnecessarily.
We have seen situations where teams responded to performance issues by increasing cluster sizes rather than addressing the root cause. While larger clusters may temporarily improve query performance, they also increase cloud spending. In many cases, optimizing the underlying Delta tables delivered similar or better performance improvements without requiring additional infrastructure.
When queries scan less data and workloads perform fewer unnecessary shuffle operations, jobs complete faster and consume fewer compute resources. As data volumes continue to grow, these savings become even more important. A well-optimized Delta Lake environment not only improves current workload efficiency but also helps prevent cloud costs from growing at the same rate as the data itself.
Faster reporting and dashboard performance for end users
While cloud cost savings often get the most attention, the benefit that business users notice first is usually faster reporting and dashboard performance.
Dashboards that once loaded in a few seconds can gradually become slower as data volumes increase. Reports that previously completed within acceptable timeframes start taking significantly longer, creating frustration for users who relied on timely information to make decisions. In many cases, the issue is not the reporting tool itself. It is the underlying Delta tables supporting those workloads.
When tables are optimized, Databricks can retrieve data more efficiently. Proper partitioning, file compaction, and ZORDER reduce the amount of data that needs to be scanned and processed for each query. As a result, reports and dashboards respond faster, even as data volumes continue to grow.
The business impact goes beyond user convenience. Faster dashboards enable teams to access information when they need it rather than waiting for reports to load. Operational teams can respond more quickly to business events, managers can make decisions using current data, and analysts spend less time waiting for queries to complete.
Performance improvements also help organizations meet reporting SLAs more consistently. Data pipelines complete on time, scheduled reports are delivered when expected, and business users gain greater confidence in the platform. When reporting systems perform reliably, support requests related to slow dashboards and delayed reports tend to decrease as well.
Users rarely notice when a table has been optimized. What they notice is that the information they need becomes available faster.
A more scalable platform that supports new use cases without proportional cost growth
One of the biggest challenges organizations face is scaling their data platforms as business demands continue to grow. New dashboards are created, additional data sources are onboarded, reporting requirements expand, and teams begin exploring advanced analytics and AI initiatives. The question is whether the platform can support that growth efficiently.
We have seen environments where every increase in workload required a corresponding increase in compute resources. As more data arrived and more users accessed the platform, cloud costs grew at almost the same rate. While the platform technically scaled, it became increasingly expensive to operate.
Poorly optimized Delta tables often contribute to this problem. When workloads repeatedly scan unnecessary data, process inefficient partitions, or perform excessive shuffle operations, each new use case adds more pressure to the platform. Over time, teams are forced to increase cluster sizes simply to maintain existing performance levels.
Optimization helps break that pattern. When data is organized efficiently and queries process only the information they actually need, the platform can support larger workloads without requiring proportional increases in infrastructure. New reports, dashboards, and analytics workloads can be introduced while keeping compute growth under control.
This becomes particularly important as organizations expand their use of data. Business teams want faster access to insights, leadership wants more reporting capabilities, and data teams are often expected to support machine learning and AI initiatives on the same platform. A well-optimized Delta Lake foundation makes that growth sustainable.
From a business perspective, scalability is not just about handling more data. It is about supporting new opportunities without allowing costs to grow at the same pace.
How to assess your current Delta Lake health
Signals that your tables need attention: slow queries, rising costs, growing file counts
Problems with Delta Lake optimization usually develop gradually rather than appearing overnight. Because of that, many teams do not realize their tables need attention until performance issues start affecting business users or cloud costs begin increasing noticeably.
The first signal to look for is slow query performance. If dashboards that once loaded in seconds are now taking noticeably longer, or if reporting jobs are consistently running close to SLA deadlines, it is worth investigating the underlying Delta tables. While some slowdown is expected as data grows, significant performance degradation can indicate optimization issues.
Another common indicator is rising compute costs without a corresponding increase in business value. Cloud spending can continue to climb even though the number of reports, users, and workloads remains relatively stable. In many cases, inefficient table layouts, unnecessary data scans, or small file accumulation are contributing to the increased resource consumption.
Growing file counts are another warning sign. As ingestion pipelines continue writing data, thousands of small files can accumulate over time. The data itself may be correct, but Databricks must spend additional effort managing and scanning those files before executing queries. This often results in slower performance and higher compute usage.
It is also worth paying attention to operational patterns. Frequent cluster scaling, longer job runtimes, increased shuffle activity, and repeated performance tuning efforts can all indicate that the underlying table structure is no longer supporting the workload efficiently.
The key is to identify these signals early. Addressing optimization challenges when they first appear is typically much easier and less expensive than waiting until reporting performance, cloud costs, and user satisfaction are significantly affected.
A starting framework for prioritizing which tables to optimize first
When organizations begin looking at Delta Lake optimization, one of the first questions is where to start. In large Databricks environments, there may be hundreds or even thousands of tables, making it unrealistic to optimize everything at once.
The most effective approach is to focus on business impact first. Start by identifying the tables that support critical dashboards, executive reporting, operational processes, or high-visibility analytics workloads. Improvements in these areas are often noticed immediately by both business users and leadership.
Next, look at query activity and compute consumption. Tables that are queried frequently and consume a significant amount of cluster resources typically offer the greatest optimization opportunities. Even small performance improvements on heavily used datasets can generate meaningful cost savings over time.
File count is another useful indicator. Tables containing large numbers of small files are often strong candidates for optimization because they can create unnecessary metadata overhead and increase scan times. Similarly, tables experiencing rapid growth in data volume should be reviewed before performance issues become more difficult to manage.
It is also worth reviewing workload patterns. If multiple reports, dashboards, or pipelines depend on the same table, optimizing that dataset can improve performance across several downstream processes at once. These shared datasets often provide the highest return on effort.
In practice, a simple three-tier prioritization works well:
High priority: Business-critical tables with high query volume, growing costs, or visible performance issues.
Medium priority: Frequently used datasets that show early signs of inefficiency but are not yet impacting users significantly.
Low priority: Infrequently accessed tables with minimal business impact or stable performance.
The goal is not to optimize the largest tables first. The goal is to optimize the tables that deliver the greatest business value.
How to build optimization into regular platform operations rather than treating it as a one-off fix
One mistake organizations make is treating Delta Lake optimization as a project rather than an ongoing operational practice. A team notices performance issues, runs a few optimization commands, sees immediate improvements, and then moves on. Unfortunately, the conditions that created the problem often continue, which means the same issues gradually return over time.
Data platforms are constantly evolving. New data arrives every day, workloads change, additional reports are created, and business users develop new ways of consuming data. As these changes occur, file counts grow, query patterns shift, and previously effective optimization strategies may become less efficient.
The most successful teams build optimization into their regular platform operations. Instead of waiting for performance complaints or unexpected cloud cost increases, they proactively monitor table health, query performance, file counts, and workload efficiency. Optimization becomes part of routine maintenance, similar to monitoring pipelines or managing data quality.
Regular review cycles for high-priority datasets help teams periodically evaluate query history, review partition effectiveness, identify growing file counts, and determine whether tables would benefit from OPTIMIZE or ZORDER operations. This allows issues to be addressed before they begin affecting business users.
Automation can also play an important role. Scheduled optimization jobs, monitoring dashboards, and operational alerts help ensure that performance and efficiency remain consistent as data volumes grow. Rather than relying on manual intervention, optimization becomes a repeatable process within the platform.
The business benefit is long-term stability. Cloud costs remain more predictable, reporting performance stays consistent, and the platform continues to scale without requiring frequent reactive tuning efforts. Instead of constantly fixing performance problems, data teams can focus on delivering new capabilities and supporting business growth.
Is your Delta Lake working against you?
The business case for proactive optimization
Organizations invest heavily in modern data platforms to improve reporting, support analytics, and create a foundation for future growth. Many performance and cost challenges, however, are not caused by the platform itself. They are often the result of optimization decisions that were delayed, overlooked, or never revisited as workloads evolved.
What starts as a few small inefficiencies can gradually become a larger business problem. Small file accumulation increases compute consumption. Poor partitioning causes unnecessary data scans. Inefficient query patterns slow down reports and dashboards. Over time, cloud costs rise, reporting performance declines, and scaling the platform becomes more expensive than it needs to be.
These challenges are often solvable. Techniques such as OPTIMIZE, ZORDER, proper partitioning, and thoughtful workload design can significantly improve performance while reducing unnecessary compute usage. More importantly, they help organizations get greater value from their existing Databricks investments rather than simply adding more infrastructure.
Delta Lake optimization is not just about making queries run faster. It is about controlling cloud costs, meeting reporting SLAs, improving user experience, and building a platform that can support future business needs without proportional cost growth.
If your cloud spend is increasing, dashboards are becoming slower, or platform performance is becoming harder to maintain, it may be worth asking a simple question: is the problem really your workload volume, or is your Delta Lake no longer optimized for the way your business uses data today?
Answering that question early can help prevent small technical inefficiencies from becoming larger operational and financial challenges down the road.
Questions engineering and data leaders should be asking today
As data volumes continue to grow, optimization becomes less about technical housekeeping and more about operational efficiency. Engineering and data leaders should regularly consider the following:
Are our most critical Delta tables optimized for the way users actually query them?
Is cloud spend increasing because of business growth, or because of inefficient workloads?
Which tables consume the most compute resources, and are they delivering proportional business value?
Are we proactively monitoring table health, or only reacting when performance issues appear?
Can our current platform support new analytics, reporting, and AI initiatives without significantly increasing costs?
Next steps and how Tenjumps can help
Delta Lake optimization is not a one-time exercise. As workloads evolve and data volumes grow, maintaining an efficient platform requires a combination of good engineering practices, governance, and ongoing operational oversight.
At Tenjumps, we help organizations assess Delta Lake performance, identify inefficiencies, and implement practical optimization strategies that improve query performance, reduce cloud costs, and support long-term scalability. Whether the challenge is small file accumulation, ineffective partitioning, inefficient workloads, or overall platform optimization, the goal is the same: helping teams get more value from their Databricks investment.
The most successful optimization initiatives start with visibility. Understanding where performance bottlenecks and unnecessary costs exist today is often the first step toward building a faster, more scalable, and more cost-efficient data platform for tomorrow.
Share